| . |
. |
Turnout in Presidential Election |
. |
. |
| . |
. |
| . |
. |
. |
. |
. |
. |
. |
. |
. |
. |
. |
. |
. |
. |
. |
. |
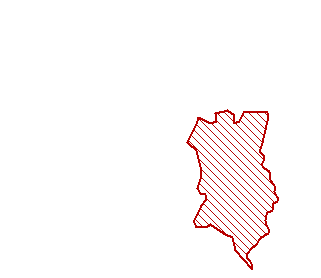
| Polska / dolnośląskie, woj. / lubiński, pow. / Ścinawa, gm. |
 |
| Ścinawa, gm. |
| Statistics on 30.06.2005 |
| Population: |
10731 |
| Area: |
164.56 km2 |
| Population density: |
65 os/km2 |
| Summary voting results |
| Number of polling wards: |
7 |
| Number of polling wards which transmitted the results: |
7 |
| Number of people entitled to vote: |
8389 |
| Number of ballot papers issued: |
3720 |
44.34% |
|
| lack | 42.50% | 43.20% | 43.90% | 44.60% | 45.30% | 46.00% | 46.70% | 47.40% | 48.10% | 48.80% | | | . | . | . | . | . | . | . | . | . | . | . | . | | of data | 43.19% | 43.89% | 44.59% | 45.29% | 45.99% | 46.69% | 47.39% | 48.09% | 48.79% | 49.50% | |
|
See also:
|
|
|
| |
|


 Legal Acts
 Documents
 Electoral Bodies
 Candidates
 Turnout
 Results
 Repeat ballot
 SEJM
SEJM SENATE
 Created by


 Legal Acts
 Documents
 Electoral Bodies
 Candidates
 Turnout
 Results
 Repeat ballot
 SEJM
SEJM SENATE
 Created by


