| . |
. |
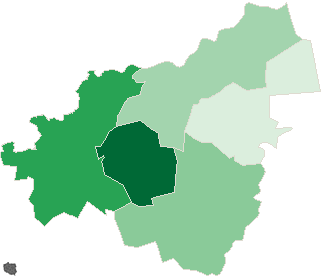
Number of people who has voted until 10:30 |
. |
. |
| . |
. |
| . |
. |
. |
. |
. |
. |
. |
. |
. |
. |
. |
. |
. |
. |
. |
. |
| Polska / małopolskie, woj. / wielicki, pow. |
 |
| wielicki, pow. |
| Statistics on 30.06.2005 |
| Population: |
102383 |
| Area: |
409.98 km2 |
| Population density: |
249 os/km2 |
| Election Statistic |
| Number of polling wards: |
70 |
| Number of polling wards which transmitted the results: |
70 |
| Number of people entitled to vote: |
79048 |
| Number of ballot papers issued: |
7451 |
9.43% |
|
| lack | 6.45% | 7.05% | 7.65% | 8.25% | 8.85% | 9.45% | 10.05% | 10.65% | 11.25% | 11.85% | | | . | . | . | . | . | . | . | . | . | . | . | . | | of data | 7.04% | 7.64% | 8.24% | 8.84% | 9.44% | 10.04% | 10.64% | 11.24% | 11.84% | 12.45% | |
|
See also:
|
| . |
. |
Number of people entitled to vote, Number of ballot papers issued |
. |
. |
| . |
. |
| . |
. |
. |
. |
. |
. |
. |
. |
. |
. |
. |
. |
| No. |
Name |
No. of polling |
No. of people
entitled to vote |
No. of
ballot papers
issued |
No. of: ballot papers issued / entitled to vote [%] |
| wards |
wards which
transmitted the results |
| 121901 | Biskupice, gm. | 8 | 8 | 6316 | 786 | 12.44 |  |
| 121902 | Gdów, gm. | 12 | 12 | 11862 | 1040 | 8.77 |  |
| 121903 | Kłaj, gm. | 10 | 10 | 7478 | 482 | 6.45 |  |
| 121904 | Niepołomice, gm. | 13 | 13 | 16637 | 1301 | 7.82 |  |
| 121905 | Wieliczka, gm. | 27 | 27 | 36755 | 3842 | 10.45 |  |
| |
wielicki, pow. |
70 |
70 |
79048 |
7451 |
9.43 |
 |
|
| |
| . |
. |
Turnout by location of ward electoral commission |
. |
. |
| . |
. |
| . |
. |
. |
. |
. |
. |
. |
. |
. |
. |
. |
. |
| No. |
Name |
No. of polling |
No. of people
entitled to vote |
No. of
ballot papers
issued |
No. of: ballot papers issued / entitled to vote [%] |
| wards |
wards which
transmitted the results |
| 1 | rural commune | 30 | 30 | 25656 | 2308 | 9.00 |  |
| 2 | urban - rural commune | 40 | 40 | 53392 | 5143 | 9.63 |  |
|
|


 Legal Acts
 Documents
 Electoral Bodies
 Candidates
 Turnout
 Results
 Repeat ballot
 SEJM
SEJM SENATE
 Created by

 Legal Acts
 Documents
 Electoral Bodies
 Candidates
 Turnout
 Results
 Repeat ballot
 SEJM
SEJM SENATE
 Created by


