| . |
. |
Turnout in Presidential Election |
. |
. |
| . |
. |
| . |
. |
. |
. |
. |
. |
. |
. |
. |
. |
. |
. |
. |
. |
. |
. |
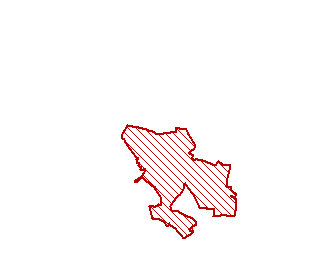
| Polska / śląskie, woj. / lubliniecki, pow. / Koszęcin, gm. |
 |
| Koszęcin, gm. |
| Statistics on 30.06.2005 |
| Population: |
11518 |
| Area: |
128.54 km2 |
| Population density: |
89 os/km2 |
| Summary voting results |
| Number of people entitled to vote: |
9069 |
| Number of ballot papers issued: |
4539 |
| Total votes: |
4538 |
| Number of valid votes: |
4509 |
50.05% |
|
| lack | 33.08% | 35.00% | 36.92% | 38.84% | 40.76% | 42.68% | 44.60% | 46.52% | 48.44% | 50.36% | | | . | . | . | . | . | . | . | . | . | . | . | . | | of data | 34.99% | 36.91% | 38.83% | 40.75% | 42.67% | 44.59% | 46.51% | 48.43% | 50.35% | 52.28% | |
|
See also:
|
|
| |
|
|


 Legal Acts
 Documents
 Electoral Bodies
 Candidates
 Turnout
 Results
 Repeat ballot
 SEJM
SEJM SENATE
 Created by
 Legal Acts
 Documents
 Electoral Bodies
 Candidates
 Turnout
 Results
 Repeat ballot
 SEJM
SEJM SENATE
 Created by


